Solar Panel Degradation: How Performance Drops Over 25 Years and What to Expect
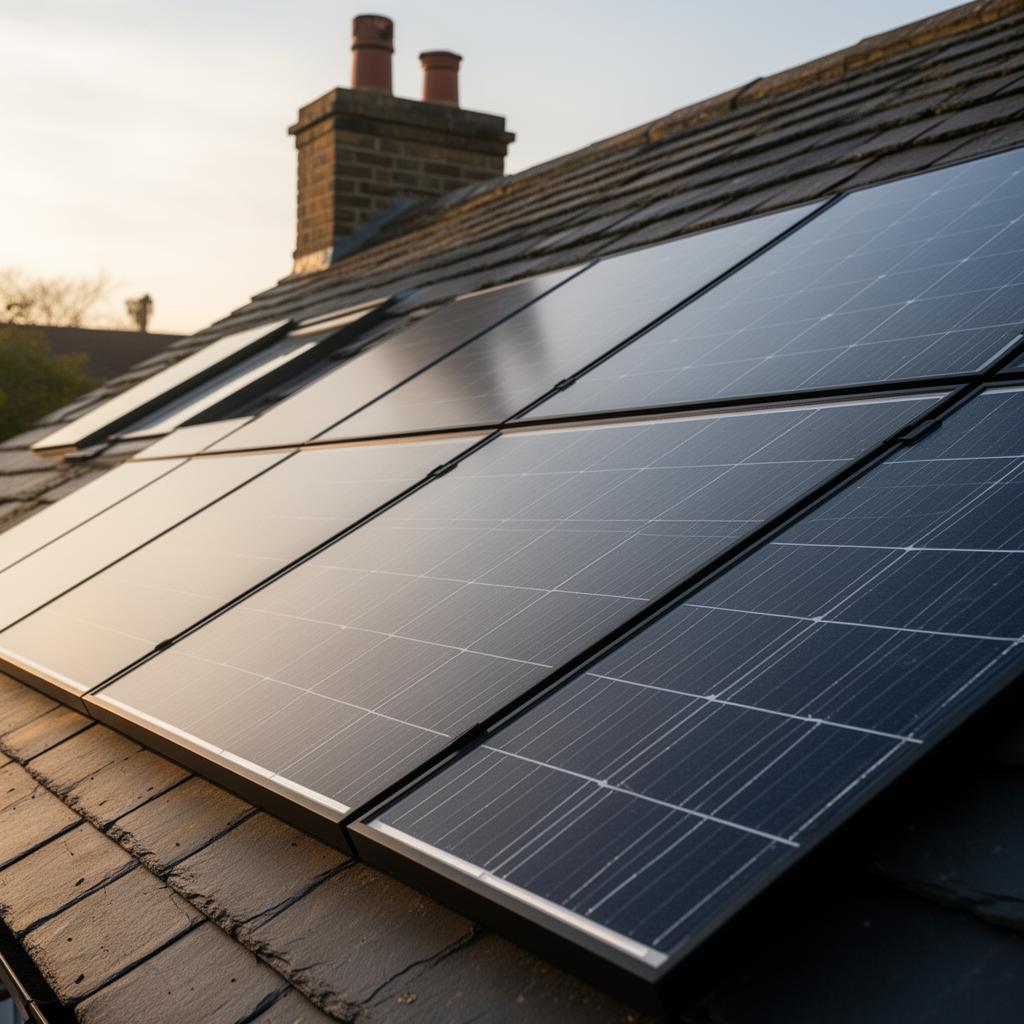
Solar panels do not last forever at peak performance. Like all technology, they gradually lose efficiency over time. Understanding the solar panel degradation rate is essential for setting realistic expectations about long-term output and accurately calculating your return on investment. The good news is that modern panels degrade slowly, with most losing only around 0.5% of output per year. Over 25 years, that means your panels will still be producing 87-90% of their original capacity. This guide explains what causes degradation, how modern panels compare to older technology, and what you can realistically expect from your system over its lifetime.
How Much Do Solar Panels Degrade Over 25 Years?
Solar panels typically degrade at a rate of 0.3–0.5% per year, meaning a panel producing 400W when new will still generate around 340–360W after 25 years — retaining 85–90% of its original output. Most manufacturers guarantee at least 80% performance at 25 years and 87.5% at the midpoint. Modern monocrystalline panels degrade more slowly than older polycrystalline models.
In practical terms, a 4kW system generating 3,800 kWh in its first year would still produce around 3,200–3,400 kWh in year 25 — well within the range needed to deliver a strong financial return. The biggest threat to long-term performance is not degradation but physical damage from storms, bird droppings reducing output, or a failed inverter (which typically lasts 10–15 years and costs £800–£1,500 to replace). Regular cleaning and an inverter replacement at the halfway point will keep your system performing close to its rated output throughout its lifetime.
What Is Solar Panel Degradation?
Solar panel degradation is the gradual, permanent reduction in a panel’s ability to convert sunlight into electricity. It is measured as a percentage loss per year from the panel’s original rated output. A panel rated at 400W with a 0.5% annual degradation rate would produce approximately 398W after one year, 396W after two years, and so on.
Degradation is an inherent characteristic of silicon-based photovoltaic cells and cannot be completely prevented. However, the rate of degradation has improved dramatically over the past two decades as manufacturing quality and cell technology have advanced.
It is important to distinguish degradation from temporary output variations. Cloud cover, seasonal changes, dirt, and temperature all cause fluctuations in daily and monthly output, but these are not degradation. Degradation is the permanent, underlying decline in the panel’s maximum potential output under ideal conditions.
Typical Solar Panel Degradation Rates in the UK
The standard degradation rate quoted by most panel manufacturers is around 0.4-0.55% per year for modern monocrystalline panels. This is the rate used in performance warranty calculations. However, degradation does not follow a perfectly linear path.
Initial degradation (LID)
Most solar panels experience a slightly higher degradation rate in the first year of operation, known as Light-Induced Degradation (LID). When the silicon cells are first exposed to sunlight, certain impurities in the silicon react and cause a one-off output drop of 1-3%. After this initial period, degradation settles to a much slower, steady rate.
Some premium panel manufacturers use n-type silicon cells that are resistant to LID, reducing first-year degradation to near zero. This is one advantage of paying slightly more for top-tier panels.
Annual degradation over 25 years
| Panel Age | Output (% of original) | 4 kW System Output |
|---|---|---|
| Year 0 (new) | 100% | 3,400 kWh |
| Year 1 (after LID) | 97-99% | 3,300-3,366 kWh |
| Year 5 | 95-97% | 3,230-3,300 kWh |
| Year 10 | 93-95% | 3,162-3,230 kWh |
| Year 15 | 90-93% | 3,060-3,162 kWh |
| Year 20 | 88-90% | 2,992-3,060 kWh |
| Year 25 | 85-90% | 2,890-3,060 kWh |
| Year 30 | 82-87% | 2,788-2,958 kWh |
As you can see, even after 25 years a well-made panel retains the vast majority of its original output. A 4 kW system that generates 3,400 kWh in its first year will still be producing around 2,900-3,060 kWh in year 25. That is still a substantial amount of free electricity.
How Performance Warranties Guarantee Long-Term Output
Every reputable solar panel manufacturer provides a performance warranty (sometimes called a power output warranty) that guarantees a minimum output level at specific intervals, typically 25 or 30 years.
Modern panel performance warranties typically guarantee:
- 97-98% output at the end of year 1
- 0.4-0.55% maximum annual degradation from year 2 onwards
- 87-90% output at the end of 25 years
- Some premium brands now offer 30-year warranties guaranteeing 87-89%
If your panels degrade faster than the warranty specifies, the manufacturer is obligated to repair, replace, or compensate you. This provides a financial safety net, though it is important to note that you need to be able to prove the degradation is beyond warranty limits, which typically requires professional testing.
What Causes Solar Panel Degradation?
Several physical and chemical processes contribute to degradation over time.
Light-Induced Degradation (LID)
As mentioned, LID occurs when boron-oxygen defects in the silicon are activated by sunlight in the first hours to weeks of exposure. This is a one-off effect that reduces output by 1-3%. N-type panels are largely immune to LID, which is why they are increasingly popular despite their slightly higher cost.
Potential-Induced Degradation (PID)
PID occurs when voltage differences between the solar cells and the panel frame cause ion migration within the panel, reducing cell performance. It is accelerated by heat and humidity. Modern panels are tested and rated for PID resistance, and good installation practices (correct grounding and appropriate inverter technology) minimise the risk.
Micro-cracks
Micro-cracks are tiny fractures in the silicon cells that can develop during manufacturing, transportation, or installation. They are invisible to the naked eye but can reduce cell performance by disrupting the flow of electricity. Thermal cycling (repeated heating and cooling) and mechanical stress (wind, snow loads) can propagate micro-cracks over time.
Half-cut cell technology, now standard on most modern panels, reduces the impact of micro-cracks by limiting the affected area. A micro-crack in a half-cut cell affects a smaller portion of the panel’s total output compared to a full-cell design.
UV degradation of encapsulant
The transparent encapsulant material (typically EVA) that protects the cells can yellow over decades of UV exposure, reducing the amount of light reaching the cells. Modern panels use improved encapsulant formulations that are more UV-resistant than those used in older panels.
Thermal cycling
The daily cycle of heating during the day and cooling at night causes materials to expand and contract repeatedly. Over years, this can stress solder joints, cell interconnections, and the encapsulant. The UK’s relatively mild climate means thermal stress is lower than in regions with extreme temperature swings.
How Modern Panels Compare to Older Technology
Solar panel durability has improved substantially over the past 15 years. If you had panels installed in the early 2010s, they may be experiencing faster degradation than what modern panels would deliver.
| Panel Generation | Typical Annual Degradation | 25-Year Output Retention |
|---|---|---|
| Pre-2010 polycrystalline | 0.7-1.0% | 75-82% |
| 2010-2015 polycrystalline | 0.6-0.8% | 80-85% |
| 2015-2020 monocrystalline PERC | 0.5-0.6% | 85-88% |
| 2020-2026 monocrystalline (n-type) | 0.3-0.5% | 87-93% |
The shift from polycrystalline to monocrystalline PERC cells, and more recently to n-type technologies like TOPCon and heterojunction (HJT), has reduced degradation rates significantly. If you are installing panels today, you can expect better long-term performance than panels from even five years ago.
Realistic Lifetime Output Calculations
When calculating your return on investment, it is important to use degradation-adjusted figures rather than assuming constant output. Here is a realistic lifetime generation estimate for a 4 kW system in the Midlands.
- Year 1 generation: 3,400 kWh (after LID)
- Average generation over 25 years: 3,130 kWh per year (accounting for 0.5% annual degradation)
- Total 25-year generation: approximately 78,250 kWh
- Total 30-year generation: approximately 91,500 kWh
At a self-consumption value of 20p per kWh (blended rate of direct use and export), the total 25-year value is around £15,650 against a system cost of £7,000-£8,000. Even with degradation factored in, the financial case is strong.
Many panels continue producing useful electricity well beyond 30 years. Studies of the earliest solar installations from the 1980s show panels still generating at 70-80% of their original capacity after 40 years. While they are no longer at peak performance, the free electricity they provide continues to have value.
If you want to maximise your lifetime return from solar, start with high-quality panels from a reputable manufacturer with a strong degradation warranty. Get a free quote from MCS-certified installers who can recommend the best panels for your budget and long-term goals.
Frequently Asked Questions
Can I slow down solar panel degradation?
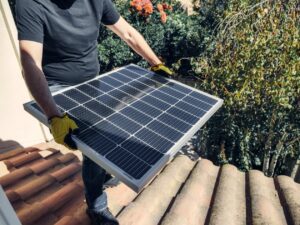
You cannot prevent degradation, but you can minimise avoidable losses by keeping panels clean, ensuring the installation is to a high standard (avoiding micro-cracks during fitting), and addressing any shading issues that could cause hot spots. Beyond that, degradation is a natural process determined by the cell technology and manufacturing quality.
How do I know if my panels are degrading faster than expected?
Compare your annual generation figures year on year, adjusting for weather variations. A consistent downward trend beyond the expected 0.5% per year could indicate accelerated degradation. Your monitoring app’s annual summaries make this comparison straightforward. If you suspect a problem, a professional IV curve test can measure each panel’s actual performance against its rated specification.
Do n-type panels really degrade less than p-type?
Yes. N-type silicon is inherently resistant to the boron-oxygen defects that cause Light-Induced Degradation in p-type cells. Studies show n-type panels experience 0.3-0.4% annual degradation compared to 0.5-0.55% for p-type PERC panels. Over 25 years, this difference means n-type panels retain 2-3% more of their original capacity, which translates to measurably more lifetime generation.
What happens to solar panels after 25-30 years?
Most panels continue working beyond their warranty period, just at reduced output. There is no point at which they suddenly stop generating. You can continue using them as long as they produce useful electricity. When output eventually drops to a level where replacement is justified, the old panels can be recycled. Solar panel recycling infrastructure in the UK is growing, and under WEEE regulations, manufacturers have obligations for end-of-life management.
Should I replace older panels with modern ones?
If your panels are still producing 70%+ of their original capacity and are not faulty, replacing them usually does not make financial sense. The remaining output is essentially free. However, if panels are severely degraded, damaged, or you need more capacity, replacing them with modern higher-wattage panels can significantly increase your system’s output from the same roof space.
See what these numbers mean for your home
Free instant estimate — costs, savings, payback and grants for your region.
Related Articles
Is Solar Battery Storage Worth It in 2026?
Solar panels are now a common sight on UK rooftops, but the real game-changer in 2026 is battery storage. A home battery lets you store the electricity your panels generate…
2 June 2026
Why Spring Is the Perfect Time to Install Solar Panels
If you have been thinking about solar panels for a while but never quite pulled the trigger, spring is the moment to act. The combination of lengthening days, mild installation…
23 April 2026
How the Energy Price Cap Affects Heat Pump and Solar Panel Payback
See how the energy price cap affects heat pump and solar panel payback periods. Real calculations using current UK unit rates show why investing now locks in stronger returns.
15 April 2026